
Real Estate Market Snapshot May 2020
We are refreshing our Youtube channel, check out our new market snapshot mini-series! Stay tuned for more content!
GTA REALTORS® Release Monthly Resale Housing Figures For April 2020
TORONTO, ONTARIO, May 5, 2020 – Toronto Regional Real Estate Board President Michael Collins released the following key housing market statistics for April 2020:
Home Sales and Listings
- Greater Toronto Area REALTORS® reported 2,975 residential transactions through TRREB’s MLS® System. This result was down by 67 per cent compared to April 2019. Weekday sales remained within a relatively steady range during the month, averaging 130 per
- New listings amounted to 6,174 in April 2020 – down on a year-over-year basis by a similar rate compared to sales (-64.1 per cent).
“The necessary social distancing and economic impacts associated with COVID-19 clearly impacted home sales and listings throughout April 2020. However, REALTORS® have been able to facilitate some transactions on behalf of buyers and sellers through the use of innovative techniques including virtual open houses. TRREB has also provided a live stream virtual open house option on Member listings featured on our public websites, and I would expect the use of these innovative techniques to increase as some level of social distancing remains in place for the foreseeable future,” said Mr. Collins.
“TRREB Members should continue to follow directives and guidance being given by the government and public health agencies. TRREB’s professional development staff are continuously working to educate our Members via virtual webinars on using technology in innovative ways to conduct business virtually, including video, virtual tours and the use of electronic forms wherever possible,” said TRREB CEO John DiMichele.
Home Prices
- The average selling price for April 2020 transactions was $821,392 – up by 0.1 per cent compared to the average price of $820,373 reported for April 2019. The semi-detached and townhouse market segments experienced annual average price growth above the rate of inflation. The condominium apartment and detached segments experienced year-over-year price declines on average.
- The trend for the MLS® Home Price Index Composite Benchmark, which had been on an upward trajectory since the beginning of 2019 flattened in April. On a year-over-year basis, the Benchmark was up by 10 per cent.
- The MLS® HPI indices represent prices for typical homes with consistent attributes from one period to the next. The fact that the MLS® HPI was up year-over-year by a greater rate than the average selling price suggests that the share of higher end deals completed in April 2020 versus April 2019 was
“When thinking about home prices, it is important to remember that the pace of price growth is dictated by the relationship between sales and listings. So, while the onset of COVID-19 has understandably shifted market conditions and resulted in average selling prices coming off their March peak, there has continued to be enough active buyers relative to available listings to keep prices in line with last year’s levels,” said Jason Mercer, TRREB’s Chief Market Analyst.
Condominium Apartment Rental Market
TRREB is also providing summary condominium apartment rental market statistics for April 2020. Conditions in the GTA rental market have also changed since the first quarter of 2020.
- Rental transactions reported through TRREB’s MLS® System were down on a year-over-year basis in April for both one-bedroom and two-bedroom condominium
- One-bedroom condominium apartment rental transactions were down by 57.9 per cent to 754; two-bedroom rental transactions were down by 54.4 per cent to
- Average rents for one-bedroom and two-bedroom apartments were down on a year-over-year basis in April 2020 as well. The average one-bedroom rent was $2,107 – down 2.7 per cent compared to April 2019. The average two-bedroom rent was $2,705 – down 4.1 per cent compared to April
“These are unprecedented times. Past recessions and recoveries do not necessarily provide the best guide as to how the housing market will recover from the impact of the COVID-19 pandemic. A key factor for the housing market recovery will be a broader reopening of the economy, which will result in an improving employment picture and a resurgence in consumer confidence. To this end, it is reassuring that the province is taking measured and carefully monitored steps towards safely opening up some parts of the economy,” said Mr. DiMichele.
Summary of TRREB MLS® Sales and Average Price – April 1 – 30, 2020
| 2020 | 2019 | |||||
| Sales | Average Price | New Listings | Sales | Average Price | New Listings | |
| City of Toronto (“416”) | 1,036 | 881,424 | 2,223 | 3,219 | 904,199 | 5,736 |
| Rest of GTA (“905”) | 1,939 | 789,317 | 3,951 | 5,786 | 773,736 | 11,476 |
| GTA | 2,975 | 821,392 | 6,174 | 9,005 | 820,373 | 17,212 |
TREB MLS® Sales By Home Type – April 1 – 30, 2020 – Home Type
| Detached | Semi-Detached | Townhouse | Condo Apartment | Other Types | All Types | ||
| All Areas | Sales | 1,412 | 324 | 532 | 667 | 40 | 2,975 |
| Yr./Yr. % Chg. | -66.0% | -62.1% | -65.3% | -71.6% | -66.4% | -67.0% | |
| Halton | Sales | 174 | 20 | 105 | 36 | 3 | 338 |
| Yr./Yr. % Chg. | -66.8% | -62.3% | -59.8% | -68.4% | -72.7% | -64.9% | |
| Peel | Sales | 237 | 93 | 116 | 73 | 1 | 520 |
| Yr./Yr. % Chg. | -72.7% | -69.0% | -69.2% | -79.6% | -91.7% | -72.9% | |
| Toronto | Sales | 313 | 126 | 108 | 482 | 7 | 1,036 |
| Yr./Yr. % Chg. | -67.9% | -54.8% | -68.4% | -69.9% | -63.2% | -67.8% | |
| York | Sales | 247 | 45 | 87 | 50 | 7 | 436 |
| Yr./Yr. % Chg. | -68.1% | -65.9% | -71.9% | -76.6% | -79.4% | -70.2% | |
| Durham | Sales | 345 | 34 | 98 | 25 | 11 | 513 |
| Yr./Yr. % Chg. | -53.1% | -51.4% | -47.6% | -53.7% | -52.2% | -52.0% |
TREB MLS® Average Price By Home Type – April 1 – 30, 2020 – Home Type
| Detached | Semi-Detached | Townhouse | Condo Apartment | Other Types | All Types | ||
| All Areas | Average Price | $983,630 | $865,971 | $681,393 | $578,283 | $649,120 | $821,392 |
| Yr./Yr. % Chg. | -3.5% | 7.0% | 3.8% | -1.7% | -3.6% | 0.1% | |
| Halton | Average Price | $1,064,805 | $765,690 | $695,854 | $506,306 | $835,000 | $870,966 |
| Yr./Yr. % Chg. | 0.7% | 10.4% | 8.5% | 0.1% | 6.4% | 1.8% | |
| Peel | Average Price | $997,803 | $745,646 | $644,549 | $490,118 | $750,000 | $802,155 |
| Yr./Yr. % Chg. | 5.1% | 5.3% | 4.3% | 7.1% | 6.2% | 6.5% | |
| Toronto | Average Price | $1,249,730 | $1,096,437 | $784,899 | $612,300 | $563,000 | $881,424 |
| Yr./Yr. % Chg. | -7.8% | 4.0% | 3.5% | -4.0% | -7.4% | -2.5% | |
| York | Average Price | $1,149,487 | $814,973 | $783,113 | $542,254 | $917,843 | $968,499 |
| Yr./Yr. % Chg. | 3.0% | 4.4% | 7.8% | 1.3% | 8.2% | 6.1% | |
| Durham | Average Price | $662,126 | $524,441 | $537,601 | $364,788 | $561,409 | $612,563 |
| Yr./Yr. % Chg. | -1.1% | 6.1% | 7.5% | -10.6% | 2.8% | 0.0% |
April 2020 Year-Over-Year Per Cent Change in the MLS® HPI
| Composite (All Types) | Single-Family Detached | Single-Family Attached | Townhouse | Apartment | |
| TRREB Total | 10.22% | 8.49% | 9.60% | 10.79% | 13.21% |
| Halton Region | 10.36% | 9.65% | 8.38% | 12.90% | 12.94% |
| Peel Region | 12.55% | 10.71% | 11.86% | 12.57% | 17.94% |
| City of Toronto | 10.43% | 7.95% | 8.24% | 8.01% | 12.51% |
| York Region | 7.66% | 6.55% | 8.32% | 6.83% | 12.74% |
| Durham Region | 9.73% | 9.03% | 10.63% | 10.57% | 14.17% |
| Orangeville | 6.87% | 6.82% | 9.78% | – | – |
| South Simcoe County1 | 10.62% | 13.00% | 9.14% | – | – |
| Source: Toronto Regional Real Estate Board | |||||
| 1South Simcoe includes Adjala-Tosorontio, Bradford West Gwillimbury, Essa, Innisfil and New Tecumseth | |||||
Annual Summary of TRREB MLS® Sales and Average Price
| Year-to-Date | ||||||
| 2020 | 2019 | |||||
| Sales | Average Price | New Listings | Sales | Average Price | New Listings | |
| City of Toronto (“416”) | 7,864 | 952,857 | 13,277 | 9,030 | 850,262 | 16,711 |
| Rest of GTA (“905”) | 14,884 | 843,898 | 25,781 | 16,057 | 758,564 | 33,789 |
| GTA | 22,748 | 881,565 | 39,058 | 25,087 | 791,571 | 50,500 |
Annual TRREB MLS® Sales & Average Price By Home Type – Year-to-Date 2020
| Sales | Average Price | |||||||||
| 416 | 905 | Total | 416 | 905 | Total | |||||
| Detached | 2,256 | 8,420 | 10,676 | 1,425,426 | 987,409 | 1,079,968 | ||||
| Yr./Yr. % Change | -7.7% | -3.7% | -4.5% | 9.9% | 9.2% | 9.1% | ||||
| Semi-Detached | 624 | 1,440 | 2,064 | 1,136,141 | 745,819 | 863,823 | ||||
| Yr./Yr. % Change | -17.5% | -6.7% | -10.2% | 8.6% | 9.8% | 8.0% | ||||
| Townhouse | 806 | 3,027 | 3,833 | 819,673 | 684,413 | 712,855 | ||||
| Yr./Yr. % Change | -13.7% | -8.4% | -9.5% | 7.9% | 11.2% | 10.1% | ||||
| Condo Apartment | 4,130 | 1,781 | 5,911 | 696,983 | 527,307 | 645,859 | ||||
| Yr./Yr. % Change | -14.7% | -20.0% | -16.4% | 13.4% | 13.3% | 13.8% | ||||
|
Apartment Type |
Month/Year |
Rentals |
Average Rent |
|||||||
| One-Bedroom | Apr. 2020 | 754 | $2,107 | |||||||
| Apr. 2019 | 1,790 | $2,165 | ||||||||
| Yr./Yr. % Chg. | -57.9% | -2.7% | ||||||||
| Two-Bedroom | Apr. 2020 | 489 | $2,705 | |||||||
| Apr. 2019 | 1,072 | $2,821 | ||||||||
| Yr./Yr. % Chg. | -54.4% | -4.1% | ||||||||
| Source: Toronto Regional Real Estate Board | ||||||||||
*Note: A broader breakout of condominium apartment and condominium townhouse rental statistics by bedroom type and TRREB areas and municipalities will continue to be provided in TRREB’s quarterly Rental Market Report.
Seasonally Adjusted TRREB MLS® Sales and Average Price
|
Sales |
Month-over-Month
% Chg. |
Average Price |
Month-over-Month % Chg. | |
| April ’19 | 7,078 | 10.2% | $787,535 | 0.7% |
| May ’19 | 7,356 | 3.9% | $802,162 | 1.9% |
| June ’19 | 7,513 | 2.1% | $812,342 | 1.3% |
| July ’19 | 7,884 | 4.9% | $824,215 | 1.5% |
| August ’19 | 7,989 | 1.3% | $825,904 | 0.2% |
| September ’19 | 7,993 | 0.1% | $837,281 | 1.4% |
| October ’19 | 7,840 | -1.9% | $839,945 | 0.3% |
| November ’19 | 7,835 | -0.1% | $846,374 | 0.8% |
| December ’19 | 7,626 | -2.7% | $874,283 | 3.3% |
| January ’20 | 7,763 | 1.8% | $875,767 | 0.2% |
| February ’20 | 8,902 | 14.7% | $904,450 | 3.3% |
| March ’20 | 6,936 | -22.1% | $894,745 | -1.1% |
| April ’20 | 2,347 | -66.2% | $789,274 | -11.8% |
Source: Toronto Regional Real Estate Board; CREA Seasonal Adjustment
1 Preliminary seasonal adjustment undertaken by the Canadian Real Estate Association (CREA). Removing normal seasonal variations allows for more meaningful analysis of monthly changes and underlying trends.
Toronto Regional Real Estate Board Releases Mid-April 2020 Market Update
TORONTO, ONTARIO, April 22, 2020 – Toronto Regional Real Estate Board President Michael Collins is reporting results for the first 17 days of April 2020, in order to provide some guidance on the impact of COVID-19 on the Greater Toronto Area housing market:
- Greater Toronto Area REALTORS® reported 1,654 home sales through TRREB’s MLS® System during the first 17 days of April – down by 69 per cent compared to the same period in
- Year-over-year sales declines, in percentage terms, were greatest for the detached and condominium apartment market segments. In the detached segment, the higher end of the market was particularly impacted in the City of Toronto. The condominium apartment segment has traditionally attracted a high share of first-time buyers, who in times of uncertainty can put their decision to purchase on
- The number of new listings was down on a year-over-year basis by a similar annual rate, declining by 63.7 per cent to 3,843.
o The fact that new listings trended in a similar fashion to sales during the first half of April means that market conditions remained tight enough to provide support for the average selling price in line with 2019 levels.
- The average selling price for sales reported during the first 17 days of April 2020 was $819,665 – down by 1.5 per cent compared to the same period in
- Uncertainty about market conditions due to COVID-19 certainly played a role in moderating the pace of year-over-year price growth during the first half of April. The changing composition of home sales also played a role. In the City of Toronto, for example, the number of homes sold for more than two-million dollars declined more than overall sales. This also had an impact on the average selling
- It should also be noted that selling prices have also followed listing prices, with average listing prices down by a similar amount. Average selling prices have not been noticeably lower than listing prices compared to last year. This is further evidence that the mix of homes listed has changed compared to last
“The state of emergency measures currently in place, including the necessary enforcement of social distancing, has impacted the real estate market in many ways. Home buyers and sellers have concerns about the economy and indeed their own employment situations. On top of this, many buyers and sellers are avoiding any type of in-person interaction. In the condo market in particular, individual condo corporations have curtailed entry for non-residents,” said Mr. Collins.
“All of the COVID-19 related issues and measures have translated into a temporary drop in the number of transactions – a drop that will persist until we experience a meaningful and sustained decline in the number of cases. However, once recovery begins, it will likely accelerate in earnest as buyers seek to satisfy pent- up demand that will build up over the course of the spring and at least part of the summer,” continued Mr. Collins.
“While the necessary social distancing efforts have certainly resulted in a substantial pause to housing transactions, it is possible that REALTORS® and their clients will be able to mitigate the impact somewhat through the use of technology. TRREB and its partner board and association Members can now take advantage of virtual open houses accessed through listing searches on TRREB.ca and REALTOR.ca.
TRREB’s professional development staff are also holding virtual webinars on other ways REALTORS can leverage technology to help their clients in these challenging times,” said John DiMichele, TRREB’s CEO.
Looking forward, the decline in home sales will be likely strongest in Q2 2020, as strong social distancing measures remain in place for most of the spring. However, if public health forecasts assuming strong social distancing measures play out as expected, we will likely start to see improvement in market activity in the summer. Recovery will accelerate through the fall, as social distancing measures are substantially relaxed, a large number of people return to work from furlough and home buyers take advantage of very low borrowing costs that will remain in place to spur economic recovery.
The calendar year average price for 2020 will likely remain near the 2019 level, and will be buoyed by the 15 per cent year-over-year growth experienced in Q1 2020 and resumed growth in Q4. Year-over-year declines in home prices could be reported during some months in the second and third quarters, but these declines will have less of an effect on the overall price for 2020 because the annual share of sales will also be much lower than normal.
“As we recover from this temporary downturn, potentially later this year, home buyers will move off the sidelines in increasing numbers as they satisfy pent-up demand for ownership housing. Increasingly, these buyers will be faced with the persistent lack of listings inventory that was a serious problem before the onset of COVID-19. As the different levels of government look toward recovery, it will be important for them to resume and build upon initiatives to bring a greater diversity of housing supply on line,” said Jason Mercer, TRREB’s Chief Market Analyst.
Summary of TREB MLS® Sales and Average Price
April 1 to 17, 2020
| 2019 Sales | 2019 Average Price | 2019 New Listings | 2020 Sales | 2020 Average Price | 2020 New Listings | |
| City of Toronto (“416”) | 588 | 885,371 | 1,381 | 1,940 | 919,788 | 3,460 |
| Rest of GTA (“905”) | 1,066 | 783,422 | 2,462 | 3,403 | 782,628 | 7,135 |
| GTA | 1,654 | 819,665 | 3,843 | 5,343 | 832,430 | 10,595 |
Source: Toronto Real Estate Board
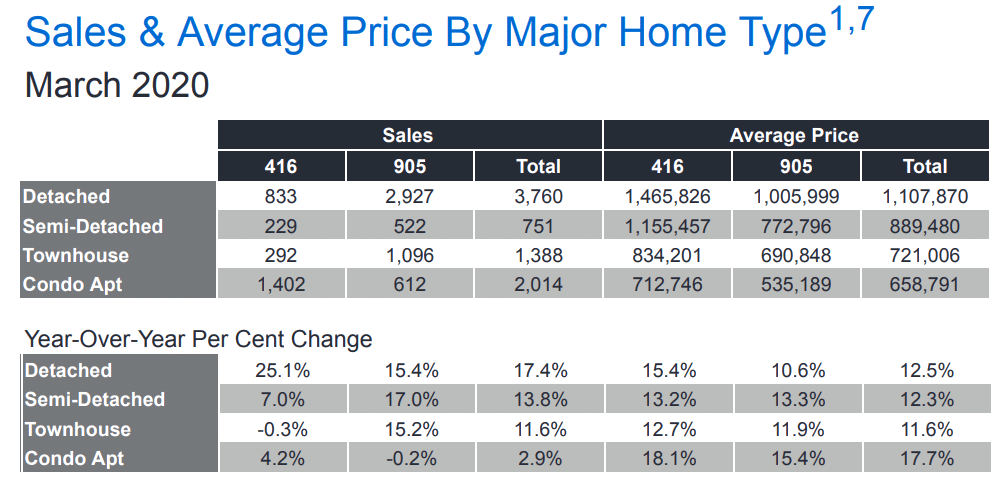
Real Estate Market Snapshot March 2020
We are refreshing our Youtube channel, check out our new market snapshot mini-series! Stay tuned for more content!
GTA REALTORS® Release Monthly Resale Housing Figures For March 2020
Toronto Regional Real Estate Board President Michael Collins announced that Greater Toronto Area REALTORS® reported 8,012 home sales through TRREB’s MLS® System in March 2020 – up by 12.3 per cent compared to 7,132 sales reported in March 2019.
However, despite a strong increase in sales for March 2020 as a whole, there was a clear break in market activity between the pre-COVID-19 and post-COVID-19 periods. For the purposes of this release, the start of the post-COVID-19 period was the week beginning Sunday, March 15.
• The overall March sales result was clearly driven by the first two weeks of the month. There were 4,643 sales reported in the pre-COVID-19 period, accounting for 58 per cent of total transactions and representing a 49 per cent increase compared to the first 14 days of March 2019.
• There were 3,369 sales reported during the post-COVID-period – down by 15.9 per cent compared to the same period in March 2019.
For March as a whole, new listings were up by three per cent year-over-year to 14,424. However, similar to sales, new listings dropped on a year-over-year basis during the second half of the month (beginning March 15) by 18.4 per cent.
The MLS® Home Price Index Composite Benchmark price was up by 11.1 per cent year-over-year in March 2020. The average selling price for March 2020 as a whole was $902,680 – up 14.5 per cent compared to March 2019. The average selling price for sales reported between March 15 and March 31, was $862,563 – down from the first half of March 2020, but still up by 10.5 per cent compared to the same period last year.
Source: The Toronto Real Estate Board

TanTeam News
 GTA March 2025 Market Update: More Affordability and Buyer ChoicesApril 9, 2025 - 1:40 PM
 GTA Housing Market in 2025: New Opportunities Emerge as Market RebalancesFebruary 5, 2025 - 12:40 PM
 2025 Canadian Real Estate Market Outlook: What You Need to KnowJanuary 31, 2025 - 2:47 PM
 Toronto’s Housing Market Shows Signs of Recovery: What This Means for Your 2025 Real Estate PlansDecember 5, 2024 - 10:57 AM
 The Perfect Storm: Canada’s Housing Market Faces Trump, Renewals, and Rate UncertaintyNovember 12, 2024 - 7:00 AM
 October Surge: GTA Home Sales Rise Amidst Lower Rates and Tighter Market ConditionsNovember 11, 2024 - 4:29 PM
 Rate Cuts, Inflation, and Mortgages: A Balancing Act of Economic ForcesOctober 20, 2024 - 6:20 PM
 A New Canadian Solution to the Housing Crisis: Unlocking Value and Building CommunityOctober 10, 2024 - 1:01 PM
 Toronto House Flipping in 2024: Market Cooldown, Anti-Flipping Rules, and Investor AdaptationsOctober 7, 2024 - 8:44 PM
 Rate Cuts Spark 8.5% Jump in September GTA Home SalesOctober 3, 2024 - 1:40 PM
EHS
 $1,660,000 – Georgetown – Halton Hills – AvailableJanuary 28, 2025 - 1:01 AM
 $747,000 – Downtown Brampton – Brampton – AvailableJune 23, 2024 - 7:00 AM
 $699,000 – East Galt – Cambridge – SoldJune 6, 2024 - 6:28 PM
 $969,000 – Malton – Mississauga – SoldJune 6, 2024 - 5:56 PM
 $1,299,000 – Snelgrove – Brampton – AvailableJune 13, 2023 - 4:16 PM
TanTeam Listings
 $525,000 – Downtown Brampton – AvailableFebruary 23, 2025 - 8:41 PM
 $551,000 – Empire South – Brantford – AvailableFebruary 14, 2025 - 9:02 PM
 $585,000 – Dempsey – Milton – AvailableJanuary 28, 2025 - 12:13 PM
 $720,000 – Courtice – Clarington – SoldJanuary 28, 2025 - 12:00 PM